ARTICLE AD BOX
Treasury futures also underscore positioning for a steeper yield curve is gathering pace.
17 Dec 2025, 06:42 AM IST i 17 Dec 2025, 06:42 AM IST 17 Dec 2025, 06:42 AM IST![]()
![]()

(Image: Bloomberg)
Summary is AI Generated. Newsroom Reviewed
Bond traders loaded up wagers on a popular strategy favoring short-end Treasuries over longer-dated debt after an unexpected uptick in November unemployment added to mixed signals clouding the outlook of the US economy.
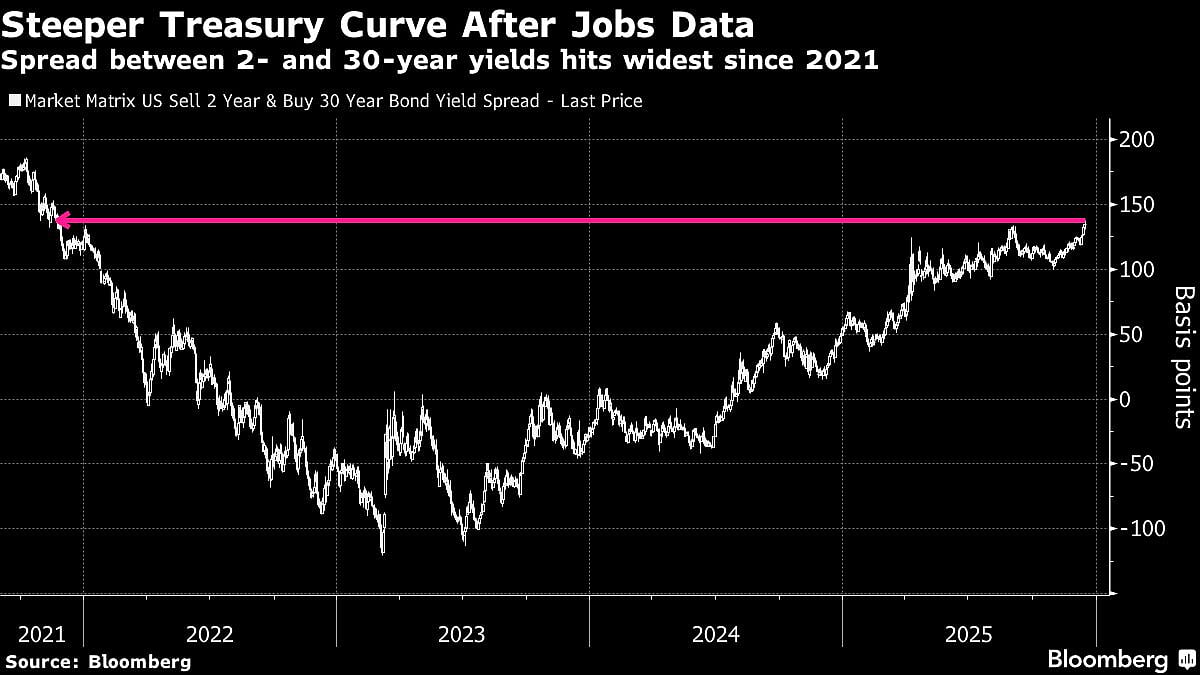
The gap between 2- and 30-year yields widened the most in over four years on Tuesday, reflecting ongoing expectations of at least two more Federal Reserve interest-rate cuts next year against a backdrop of resilient inflation and solid economic growth.
That’s all adding fuel to the so-called curve steepening trade that targets the yield gap between short and long-term debt to keep growing. The trade has gained traction since the Fed resumed cutting rates in September despite still relatively high inflation. It will be put further to the test Thursday when delayed consumer price data for November are released.
Treasury futures also underscore positioning for a steeper yield curve is gathering pace. Shifts in open interest data across the futures strip indicated fresh long positions in the short-end of the curve. Meanwhile, a $15 million premium position taken Tuesday is targeting a deeper selloff in long-dated Treasuries.
“You’ve got the 2-year anchored in by the Fed and rate-cut expectations while the back end of the curve is responding to broader issues, an economy that is not teetering on a recession and has sticky inflation,” said Kevin Flanagan, head of fixed income strategy at WisdomTree.
That leaves the 10-year yield locked in a 4% to 4.5% range, he said. On Tuesday, yields drifted lower across the curve after the data caused an initial whiplash, with the 10-year yield trading around 4.15%.
In futures, a large spread trade during Monday’s session was consistent with a wider gap between 2-year and 30-year yields for a risk weighting of $600,000 per basis point. The trade was struck while the spread was trading around 132 basis points. The spread widened Tuesday roughly to as much as 137 basis points, indicating a profit of $3 million within one day.
Here’s a rundown of the latest positioning indicators across the rates market:
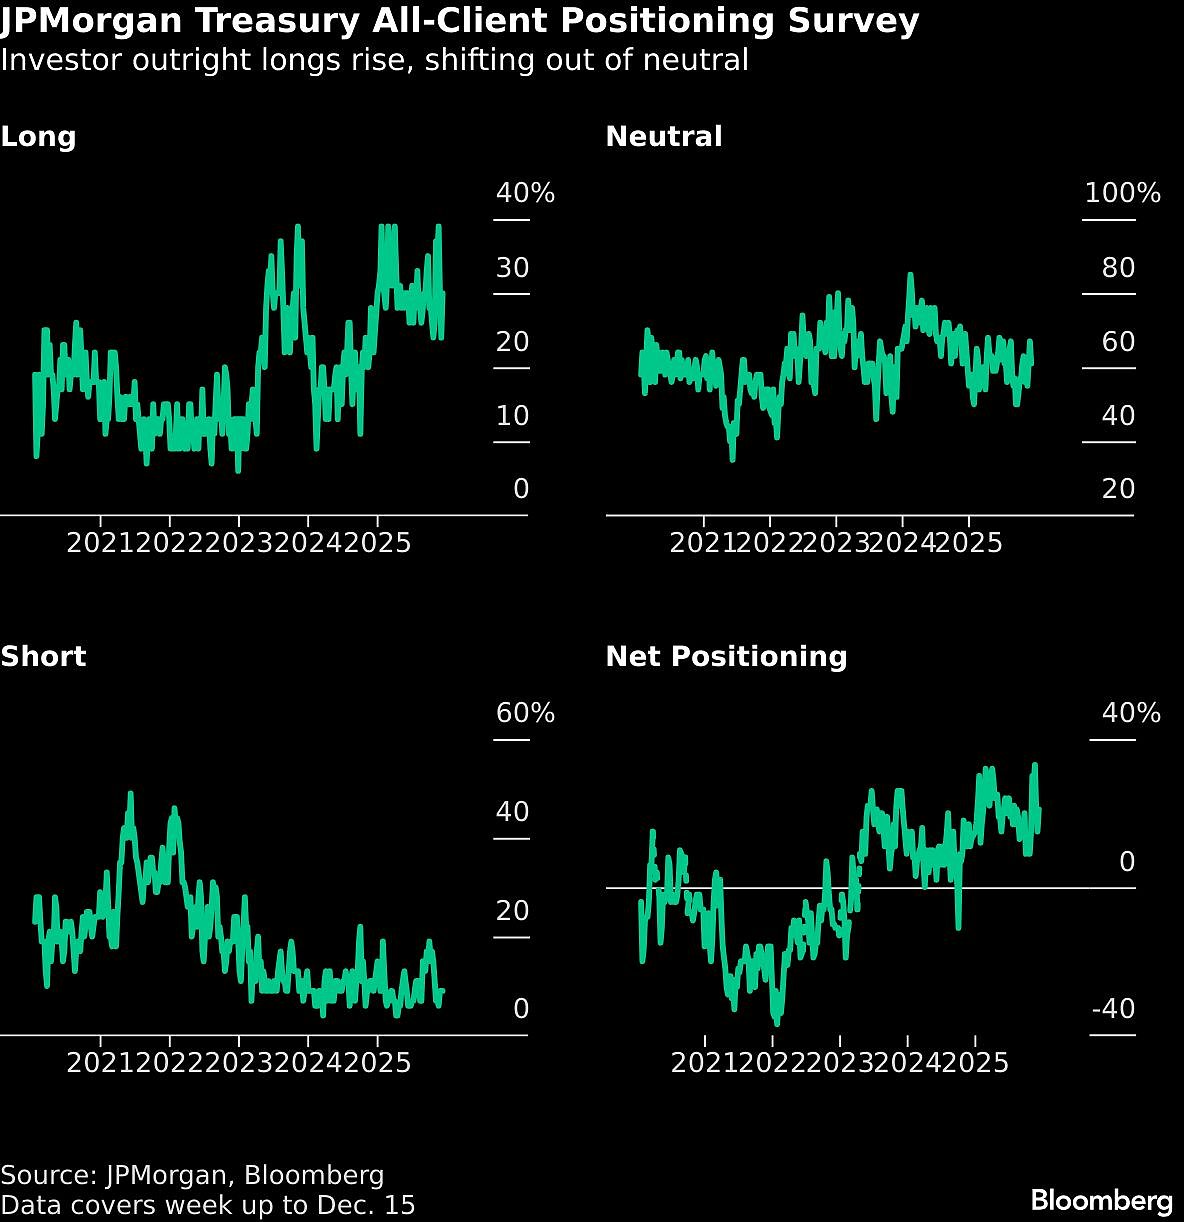
JPMorgan Survey
For the week ending Dec. 15, investors’ outright long positions rose six percentage points, switching out of neutral with outright shorts unchanged.
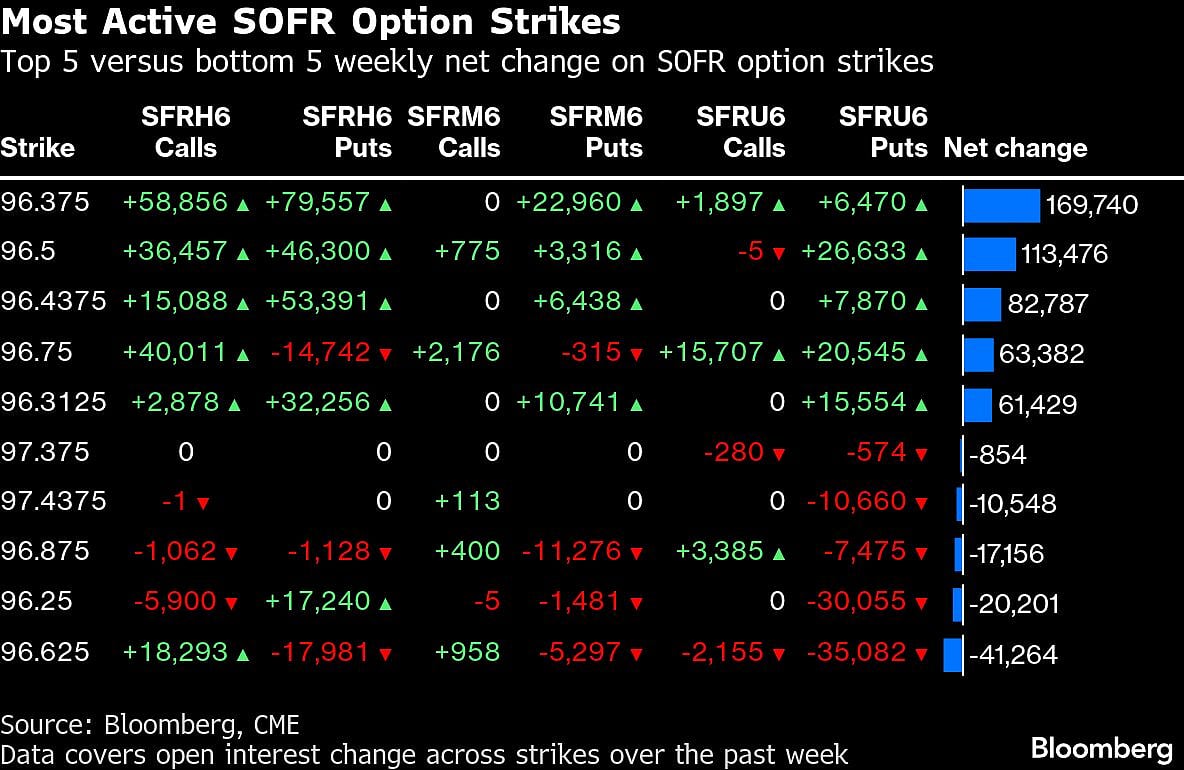
Dovish SOFR Options Added
In SOFR options across Mar26, Jun26 and Sep26 tenors there has been an influx of risk over the past week across a number of Mar26 call and put strikes as traders look to hedge both dovish and hawkish Fed policy scenarios around the first two meetings of next year. Large amount of new risk was seen via large positioning in the SOFR Mar26 96.375/96.50/96.625/96.75 call condors, while for downside positioning the Mar26 96.375/96.3125/96.1875 broken put fly has been bought along the Mar26 96.50/96.4375/96.375/96.3125 put condors which have been popular.
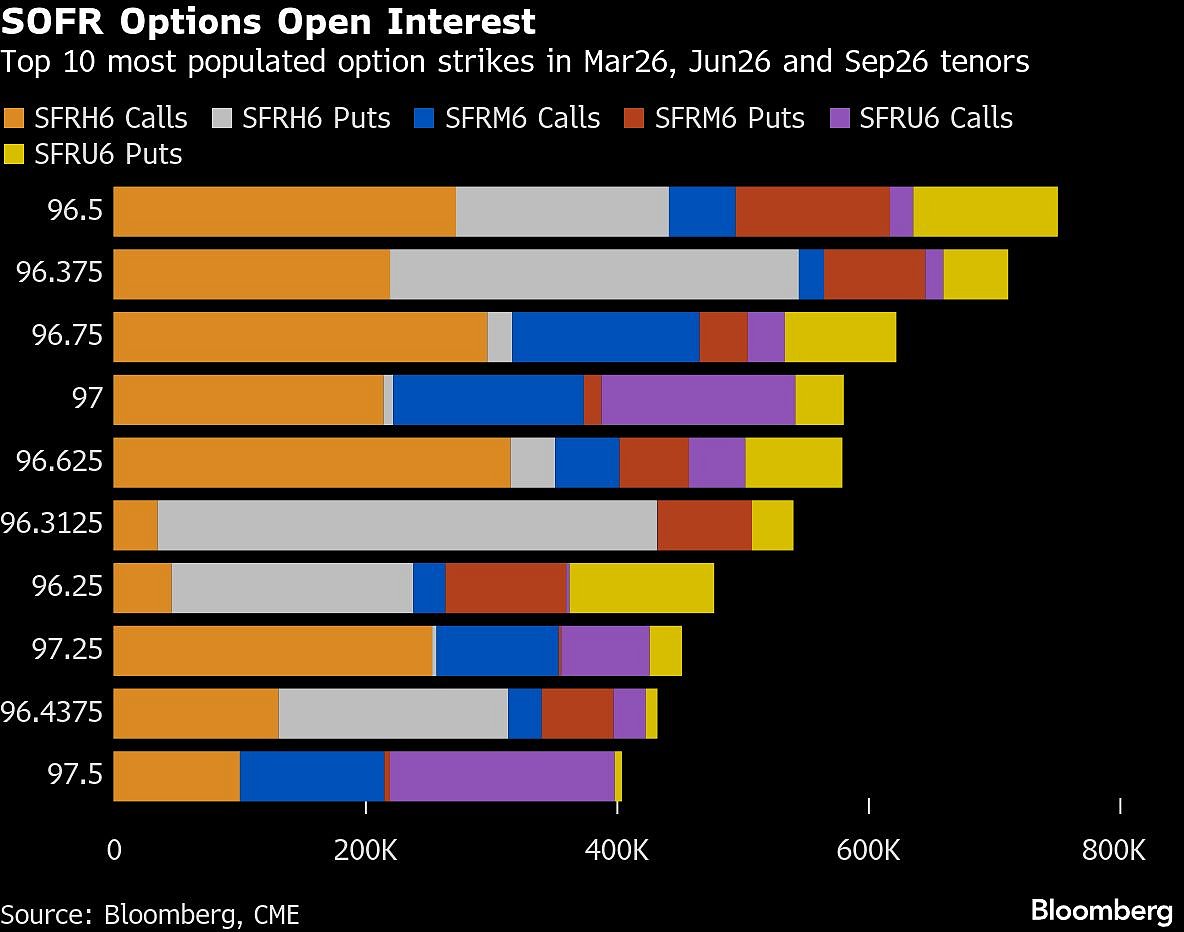
The 96.50 strike remains the most populated across Mar26, Jun26 and Sep26 options, with a large amount of open interest in both Mar26 calls and puts in the level. The 96.375 strike is the second most populated, where a large amount of Mar26 puts are situated while both the 97.00 and 96.75 strikes have a decent amount of open interest via Jun26 calls.
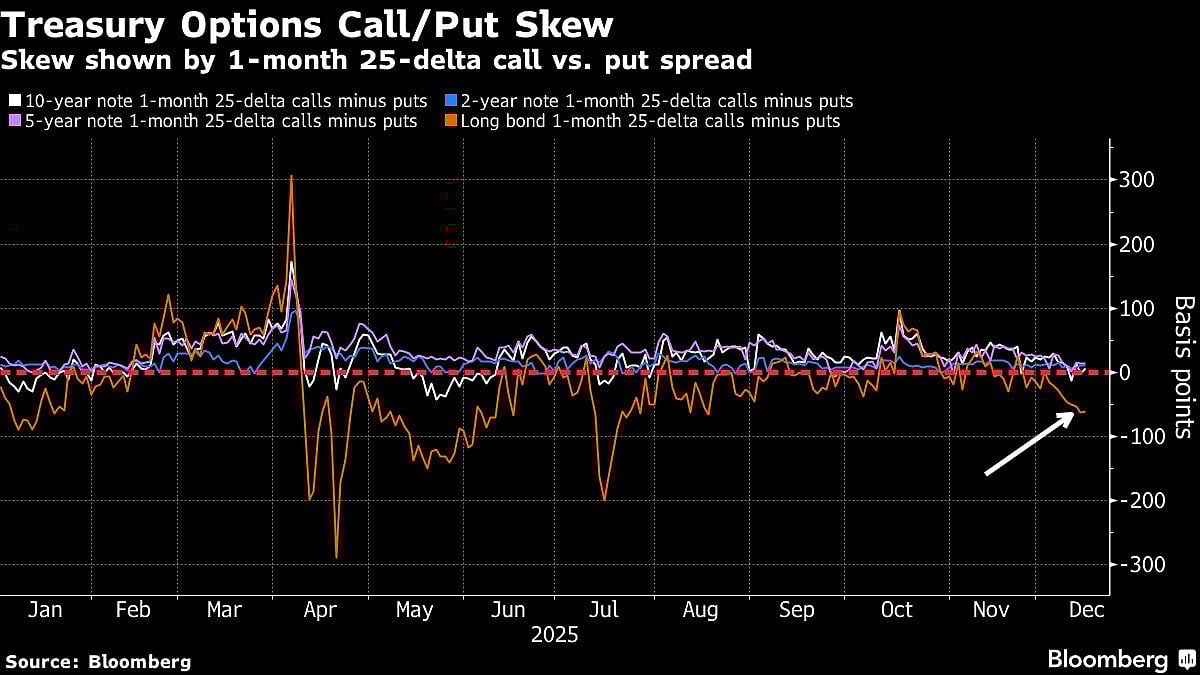
Treasury Options Premium
The premium paid to hedge Treasuries risk over the past week has continued to shift in favor of put premium over calls in the long-bond contracts, where 1-month 25 delta has moved to the most negative since August. The move reflects continued appetite for steepeners in Treasuries as investors look for the long-end of the curve to underperform the front-end and belly. On Tuesday, the 2s30s curve steepened to the widest since November 2021, topping 137 basis points.
The Japanese Bond Thriller Nobody Expected To See So Soon


 English (US) ·